What Is Observability Architecture (and How Does It Work in Smart Homes)?
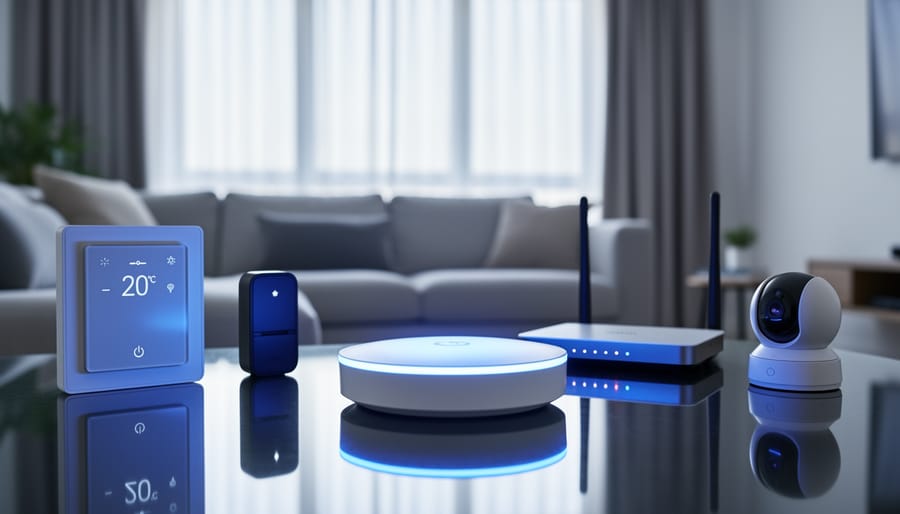
Observability architecture is the framework that lets you see, track, and understand what’s happening across all your smart home devices in real time. Instead of checking individual apps or wondering why a light didn’t turn on when it should have, this architecture collects data from every connected device, displays it in one place, and helps you spot problems before they disrupt your daily routine.
For homeowners managing everything from smart thermostats to security cameras, observability architecture transforms a collection of disconnected gadgets into a system you can actually monitor and control. You’ll know when your smart lock battery is running low, why your automated blinds didn’t close last night, or which device is hogging your Wi-Fi bandwidth.
The concept borrows from enterprise IT, where engineers need full visibility into complex systems. Your smart home might not run a data center, but the principle is the same: when you have 15, 20, or 30 connected devices, you need a clear view of how they’re performing and interacting. Without it, troubleshooting becomes guesswork, and small issues snowball into frustrating failures.
This guide breaks down how observability architecture works in practical terms, what components you’ll need to build or upgrade your system, and how to implement it yourself without needing a computer science degree. Whether you’re starting fresh or improving an existing setup, you’ll learn how to gain the visibility that makes smart home technology actually useful instead of occasionally baffling.
What Observability Architecture Means for Your Smart Home
Observability architecture is the design framework that lets you see and understand what’s happening inside your smart home network at any given moment. Think of it as the difference between knowing your thermostat is set to 72 degrees (monitoring) and understanding why your heating system runs more frequently on Tuesday mornings, which rooms take longest to warm up, and how weather changes affect your energy usage (observability). It’s about collecting data from every connected device, thermostats, lights, door locks, cameras, sensors, and turning that raw information into insights you can actually use.
The key distinction is depth of understanding. Traditional monitoring tells you if something is working or broken. Your smart doorbell either connects to WiFi or it doesn’t. Observability architecture goes further by revealing the context around that status. It shows you that your doorbell disconnects every evening around 7 PM, reconnects within minutes, and the pattern started three weeks ago when you added a new streaming device. With that information, you can pinpoint the root cause, bandwidth congestion, rather than just restarting the doorbell repeatedly.
To make sense of this system, it helps to understand the core concepts:
- Observability
- The ability to infer the internal state of a system by examining its outputs, letting you diagnose issues without knowing in advance what might go wrong.
- Telemetry
- The automatic collection and transmission of data from your smart devices to a central system where it can be analyzed and acted upon.
- Metrics
- Numerical measurements collected over time, like temperature readings, energy consumption, or WiFi signal strength.
- Logs
- Timestamped records of events and actions, such as when a door was unlocked or a motion sensor was triggered.
- Traces
- The path a command or signal takes through your smart home system, showing you exactly how devices interact with each other.
- Data Visualization
- Presenting complex data through graphs, charts, and dashboards that make patterns and problems immediately visible.
This architecture transforms your smart home from a collection of individual gadgets into a connected system you can genuinely understand and optimize. Instead of guessing why your automation routine failed or your energy bill spiked, you have the data trail to find answers.
How Observability Architecture Works in Practice
The Three Pillars: Metrics, Logs, and Traces
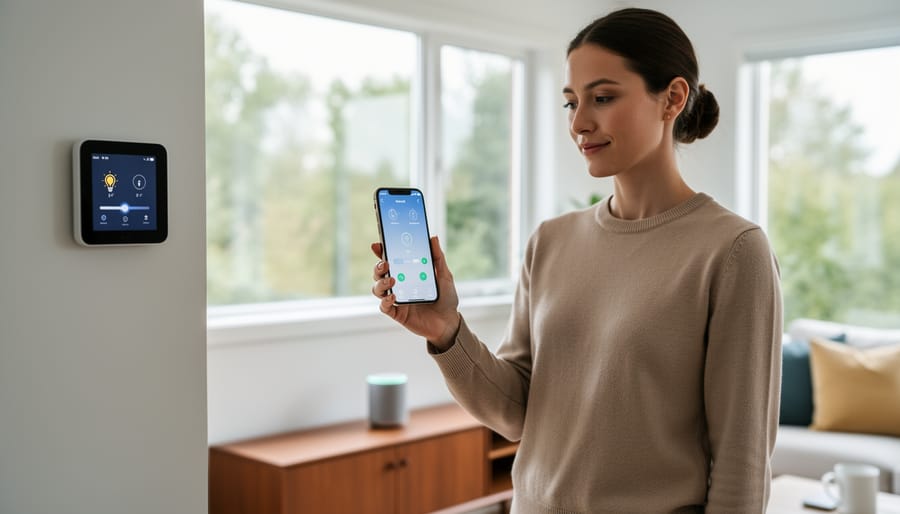
Your smart home generates three distinct types of data, what the industry calls the three observability pillars and understanding each one helps you spot problems before they disrupt your daily routine.
Metrics are the numbers your devices report continuously. Your thermostat sends temperature readings every few minutes, your security camera tracks motion detection counts, and your smart lights log power consumption. These measurements let you spot patterns: if your energy bill spikes, metrics show exactly which devices are drawing more power than usual. Think of metrics as your home’s vital signs, they tell you what’s normal and what’s not.
Logs capture specific events as they happen. When your smart lock activates, it records who unlocked it and when. If your motion sensor triggers, the log shows the exact timestamp and which zone detected movement. These detailed records become invaluable when you’re investigating an issue, like figuring out why your garage door opened at 2 a.m. last Tuesday.
Traces follow a single action through your entire smart home system. When you say “goodnight” to your voice assistant, a trace maps every step: the command reaches your hub, triggers your bedroom lights, adjusts the thermostat, and arms the security system. If one step fails, traces show you precisely where the chain broke, rather than leaving you to guess which device isn’t cooperating.
Core Components of a Smart Home Observability System
Data Collection Layer
Every piece of observability data in your smart home starts with a physical device sending information. Your smart thermostat reports temperature readings every few minutes. Motion sensors log when someone enters a room. Smart plugs track power consumption down to the watt. These devices form what’s called the data collection layer, the frontline sensors and endpoints that feed your observability system.
Think of this layer as your home’s nervous system. Door sensors detect opens and closes. Security cameras capture video feeds and motion events. Smart speakers log voice commands and responses. Even your refrigerator might report when its door stays open too long or when internal temperatures drift.
The key is that modern smart devices don’t just perform their primary function, they also generate metadata about their own performance. Your smart lock doesn’t just lock and unlock; it records battery levels, connection strength, failed access attempts, and response times. This self-reporting capability is what makes true observability possible, giving you insight into not just what happened, but how well your devices are functioning behind the scenes.
Processing and Storage Hub
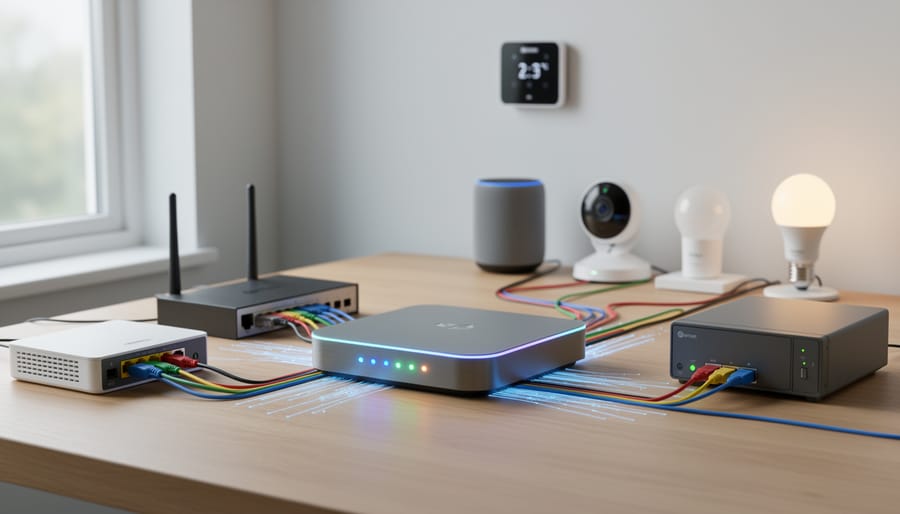
Once your devices generate data, that information needs somewhere to go, and the processing and storage hub is where the magic happens. Think of it as your home’s data brain, sitting between your sensors and the dashboards you actually see.
Most modern smart homes use a hybrid approach. A local hub (your router, a dedicated home server, or a hub device like SmartThings) handles immediate processing through smart home edge computing, making split-second decisions without waiting for internet connectivity. This keeps your lights responsive and your security system reliable even when your Wi-Fi drops.
For longer-term storage and more complex analysis, data typically flows to cloud platforms. Services like AWS IoT, Google Home, or Apple HomeKit store historical data that’s too large for local devices. The cloud handles pattern recognition, like noticing your HVAC runs inefficiently every Tuesday afternoon, and makes that information accessible from anywhere.
The best systems filter aggressively before storing anything. Your motion sensor might trigger 500 times daily, but you only need to store unusual patterns or specific events. Smart filtering keeps storage costs down and makes your data actually useful instead of overwhelming.
Visualization and Alert Systems
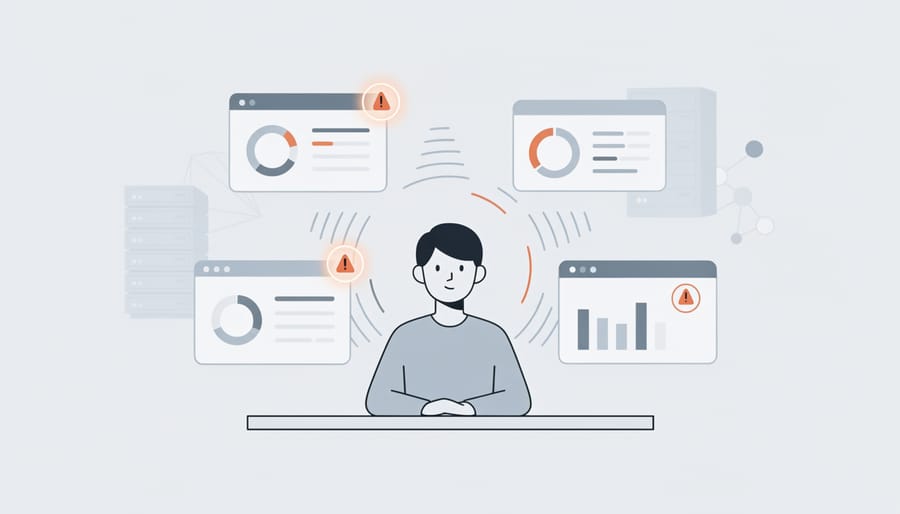
Once your smart home collects data and processes it, you need a practical way to see what’s happening and get notified when something needs attention. This is where visualization and alert systems transform all those numbers and logs into information you can actually use.
Dashboards serve as your command center, whether it’s a wall-mounted tablet in your kitchen or a web interface you access from your phone. They display real-time device status, energy consumption graphs, temperature trends, and security camera feeds in one place. Popular options in 2026 include Home Assistant’s built-in Lovelace UI, Grafana for more technical users, and manufacturer-specific apps like Samsung SmartThings or Apple Home.
Mobile apps let you check your home’s status from anywhere. The best ones organize information by room or function rather than overwhelming you with device lists. You can glance at your phone and immediately see if anything is unusual.
Alert systems are arguably the most valuable component. Instead of constantly checking dashboards, you receive notifications only when something matters: the basement sensor detects moisture, your smart lock battery is running low, or energy usage suddenly spikes. Well-configured alerts prevent problems before they become expensive repairs.
How Observability Architecture Is Used in Real Smart Home Scenarios
Let’s look at how observability architecture works in practice for homeowners. These aren’t theoretical benefits, they’re real problems that a well-designed system helps you solve every day.
Energy Management That Actually Saves Money
Instead of guessing which devices drive up your electric bill, observability shows you exactly what’s happening. Your system tracks power consumption across every outlet, appliance, and circuit. When your energy use spikes at 2 PM every Tuesday, you’ll see it’s the second-floor AC unit cycling on during peak rate hours. With that data, you can adjust schedules or catch a failing compressor that’s working overtime. Homeowners using observability for energy tracking typically spot inefficiencies within the first month that pay for the monitoring setup several times over.
Security Monitoring Beyond Basic Alerts
Traditional security systems tell you when a door opens. Observability tells you when something is wrong. If your front door sensor usually triggers twice daily but suddenly registers fifteen times, you’ll know. If your camera’s network traffic drops to zero while it’s supposed to be recording, you get an alert before you realize there’s a gap in coverage. This deeper visibility turns your security setup from reactive to predictive. You’re not just recording events, you’re understanding patterns that reveal genuine threats versus false alarms.
Preventive Maintenance That Stops Problems Early
Here’s where observability really shines for home management:
- Detecting HVAC filter clogs by monitoring airflow and runtime patterns before efficiency drops
- Spotting water heater elements starting to fail through unusual power draw curves
- Identifying smart locks with weakening batteries days before they stop working
- Catching refrigerator compressor issues when temperature recovery times increase slightly
- Noticing garage door opener strain that signals worn springs or misalignment
- Tracking irrigation valve performance to prevent landscape damage from stuck zones
Each of these scenarios means fixing a small issue before it becomes an expensive emergency. Your observability dashboard doesn’t wait until something breaks, it shows you the warning signs.
Optimizing Your Automation Routines
Smart home automation works better when you can see what’s actually happening versus what you programmed. Observability reveals that your “good morning” routine turns on the coffee maker at 6:30 AM, but your family doesn’t enter the kitchen until 7:15 AM most days. You’ll see which adaptive environments are truly responsive and which ones need adjustment. The data shows you wasted motion sensor triggers, overlapping schedules, and automation conflicts you never knew existed.
Setting Up Basic Observability in Your Smart Home: A DIY Approach
You don’t need a degree in computer science or a hefty budget to start monitoring your smart home. Here’s a practical approach using tools that most homeowners can set up in an afternoon.
Start by choosing a central hub platform. Home Assistant stands out as the best free option for 2026. It runs on a Raspberry Pi (about $75) or an old laptop you already have, and it connects to virtually every smart device brand. Install it following their step-by-step wizard, which takes about 30 minutes.
Once your hub is running, connect your existing devices. Home Assistant automatically discovers most smart devices on your network, lights, thermostats, cameras, door sensors. Click to add each one, and they start feeding data to your dashboard immediately.
Next, set up basic monitoring dashboards. The default interface shows device status, but you’ll want to customize it. Create separate views for energy usage, security status, and climate control. Drag and drop widgets that show real-time metrics and historical graphs. This visual layer transforms raw data into patterns you can actually understand.
Configure alerts for situations that matter. Set notifications when your garage door stays open past 10 PM, when indoor temperature drops below 60 degrees, or when unusual power consumption suggests a device malfunction. These alerts catch problems before they become expensive.
Add an affordable database for long-term storage. InfluxDB Community Edition is free and stores years of data on a 256GB microSD card. This historical record helps you spot trends, like your HVAC system gradually losing efficiency, that daily snapshots miss.
Finally, integrate your automation ideas with this observability layer. When you can see which automations actually trigger and their effects, you can refine them for better performance.
Total investment: under $150 if you’re starting from scratch, or potentially zero if you repurpose an old computer. The setup weekend pays for itself the first time you catch a problem early.
Common Questions About Smart Home Observability
Does implementing observability in your smart home mean sacrificing privacy or wrestling with complex technology? These concerns hold many homeowners back from gaining better control over their connected devices, even though modern solutions have become more accessible and user-friendly than ever.
Will observability systems compromise my privacy?
Most home observability setups process data locally on your network without sending information to external servers. You control what data gets collected and where it’s stored, giving you far more privacy than many commercial smart home services that rely on cloud-based data collection.
Do I need technical skills to set up observability?
Basic observability requires no more technical knowledge than setting up any smart home device. Pre-configured platforms like Home Assistant or Hubitat offer guided setup processes, and many homeowners successfully implement monitoring systems without coding or networking expertise.
Will an observability system work with my existing devices?
Modern observability platforms support hundreds of smart home brands through standard protocols like Zigbee, Z-Wave, and Wi-Fi. Most systems can integrate devices you already own, regardless of manufacturer, creating a unified view across your entire setup.
What does it cost to implement observability?
You can start with completely free open-source platforms running on hardware you might already have, like a spare computer or a Raspberry Pi. Premium commercial options range from $100-300 for hardware hubs, with optional paid features for advanced analytics or cloud storage.
The maintenance question deserves special attention since it directly impacts whether observability remains useful long-term. Most systems require minimal upkeep once configured, perhaps 15-30 minutes monthly to review automation rules and update software. This investment of time pays dividends by helping you maintain independent living skills through technology that supports rather than complicates daily routines. The systems largely run themselves, sending alerts only when they detect issues that need your attention, which means you stay informed without constant monitoring.
Key Takeaways for Homeowners
Understanding observability architecture doesn’t require a computer science degree. At its core, it’s about knowing what your smart home devices are doing, why they’re doing it, and catching problems before they disrupt your daily life. The real value comes from three data types working together: metrics show you the numbers (energy use, temperature readings), logs tell you what happened (when the front door unlocked), and traces reveal how your devices interact with each other.
Your first step costs nothing. Pick your most important smart home hub or device and explore its existing data features. Most systems already collect basic metrics you’re not using. Learn what information your devices generate naturally, then decide if you need additional tools. Free platforms like Home Assistant or node-RED can centralize data from multiple device brands without monthly subscription fees.
Privacy stays in your control with local processing. You can build an effective observability system that keeps all data on a home server rather than sending it to corporate clouds. The goal isn’t to monitor everything obsessively. It’s to have the right information available when you need to troubleshoot, optimize energy bills, or understand usage patterns that help your home run smoother.
Observability architecture turns your smart home from a bunch of disconnected gadgets into a cohesive system that actually knows what it’s doing. Instead of manually checking each device or waiting for something to break, you get a clear view of how everything works together, and more importantly, you can spot problems before they disrupt your daily routine.
You don’t need to build a NASA-level monitoring system on day one. Start with one problem area that bugs you: maybe tracking which devices drain the most energy, or getting alerts when your security cameras go offline. Pick a free tool, connect a handful of devices, and see what insights emerge. Once you understand the value, you can gradually expand to cover more of your home.
The beauty of observability is that it grows with you. As you add more devices and automation rules, your observability setup helps you maintain control rather than lose it. Your smart home becomes genuinely intelligent, not because the devices got smarter, but because you can finally see what they’re up to and make informed decisions about how they should behave.